



The Inspector is the default Pit Wall view. It plots raw telemetry channels against lap distance (or time when distance is unavailable), with every chart synchronized to the same horizontal axis.
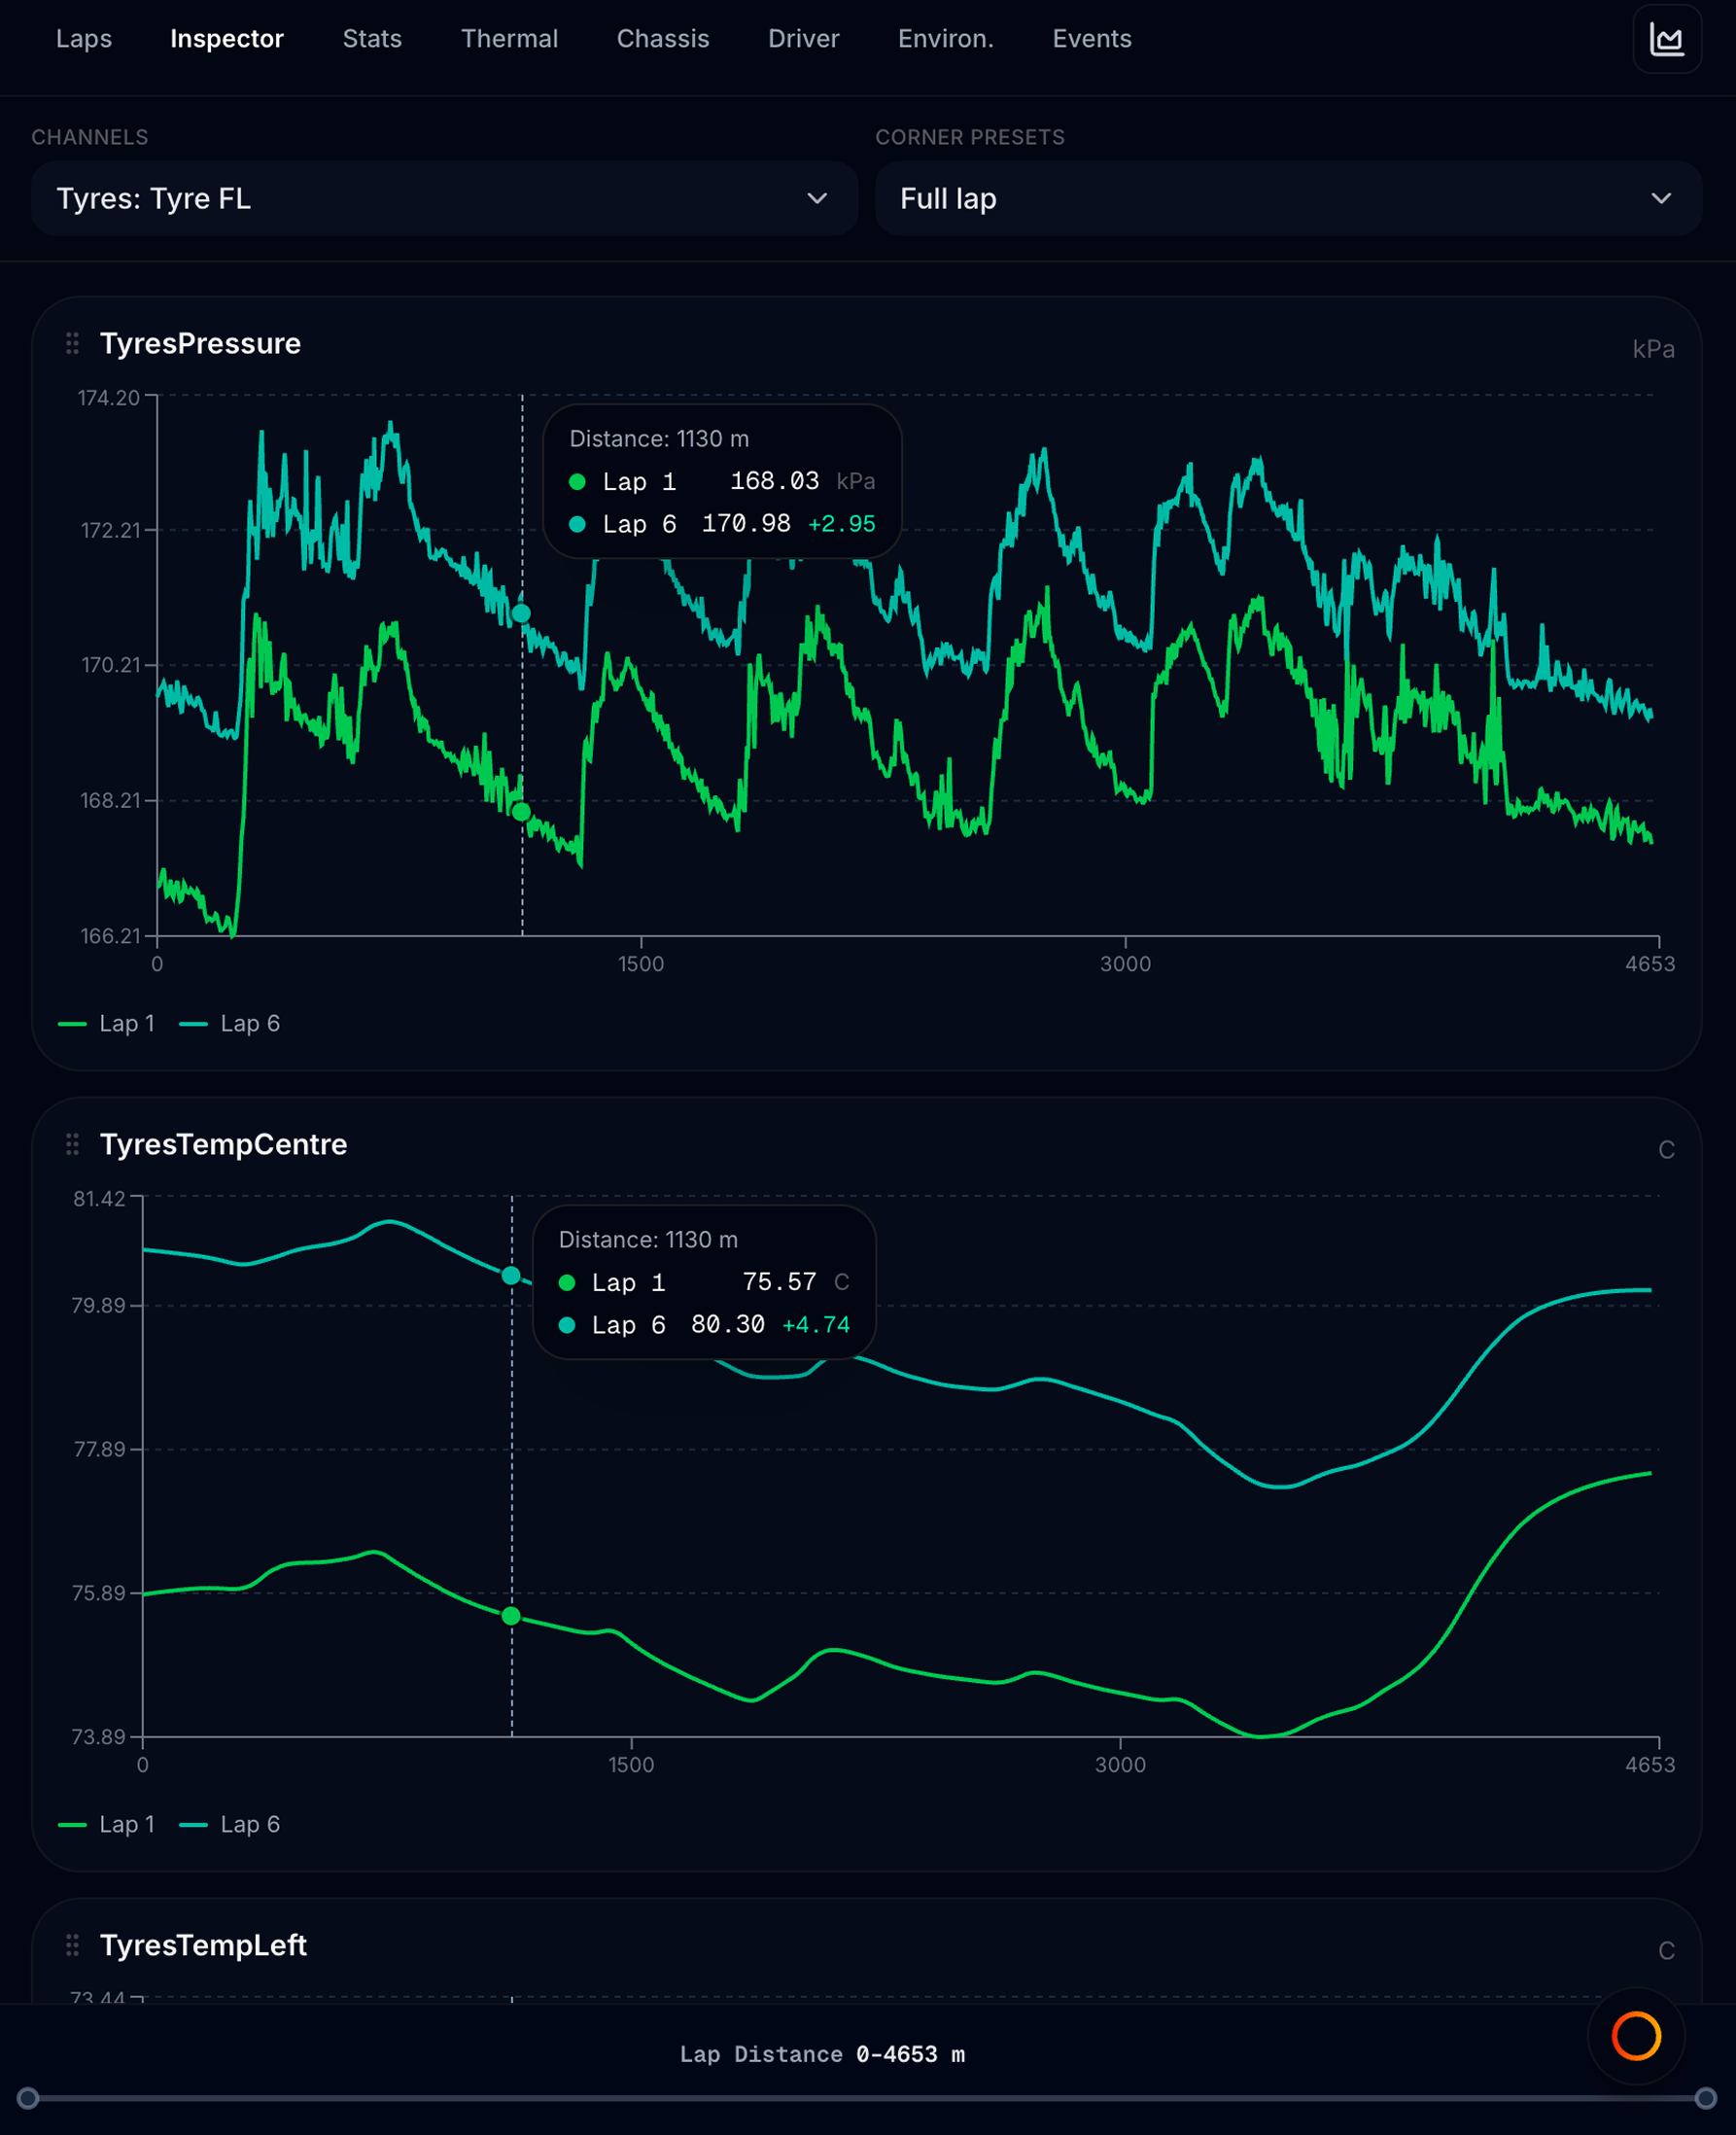
Open Pit Wall → Inspector tab (second tab; also the default when you first open Pit Wall).
How Inspector fits the layout
- Left: Track map shows racing lines for your selected laps
- Right: Inspector chart stack
- Bottom of Inspector: optional distance brush strip (when data is available)
Inspector always follows Base / Compare lap pickers on the map — not lap scope from the Laps tab.
Channel presets
Use the Channels dropdown (Inspector toolbar) to load a preset chart stack for a car subsystem:
| Group | What you typically see |
|---|---|
| Inputs | Steering, throttle, brake pedals |
| Tyres | Pressure, temperature, wear per corner |
| Brakes | Pressure and temperature per corner |
| Suspension | Ride height (mm), damper travel — front and rear axle groupings |
| Gear · Fuel · Speed | Gear, fuel/energy, speed, and Vmax · Gearing (RPM, speed, longitudinal G / long G, gear) |
| Engine | RPM, power-related channels when logged |
Ride-height channels in Suspension charts are shown in mm (same as Chassis Ride Height Distribution).
Vmax · Gearing is also reachable from Pit Wall → Chassis → Open Vmax / shift charts. Chassis shows a compact speed + long-G preview; the Inspector preset adds full channel stack, multi-lap compare, and corner zoom. After an upshift, a brief long-G dip is normal; focus on depth and recovery.
Each preset can show up to 16 channels as separate chart cards in a scrollable stack. Channels your file did not record are skipped — you get a short empty message on that card instead of a broken chart.
Select Custom at the top of the list to pick your own channels — see Custom channels. In Custom mode you can also overlay up to three channels on one chart (shared Y-axis when units match, dual Y when they differ).
Suspension curves
When a suspension preset is active, an extra Suspension curves control appears:
- Average — combine wheels on an axle into one trace per chart
- Split — separate traces per wheel (FL, FR, RL, RR)
Use split when you are diagnosing a single-corner bump or kerb strike.
Inspector toolbar
| Control | What it does |
|---|---|
| Channels | Switch preset or open Custom mode |
| Suspension curves | Average vs per-wheel layout (suspension presets only) |
| Corner presets | Zoom every chart to a named corner’s distance range, or Full lap to reset |
| Lap pickers | Shown when Full charts mode hides the map — same Base / Compare / Community controls |
Corner presets
The Corner presets dropdown lists named corners for the track (when available). Picking one zooms all Inspector charts and the track map sector focus to that corner’s distance window.
Choose Full lap to restore the full distance range. Corner zoom is independent of stint scope.
Chart cards
Each channel renders as a card in the stack:
- Title — channel name and unit
- Chart — one line per loaded lap (Base solid, Compare colours, Community dashed)
- Grip handle — drag to reorder cards in the stack
- Remove — Custom mode only; clears that slot
Charts lazy-load as you scroll — long stacks stay responsive.
Chart tools
Hover sync
Move your cursor on any chart:
- A vertical crosshair appears on every chart at the same lap distance
- The track map shows coloured position dots on each racing line
- Tooltips show values for each lap at that point
Use this to answer: At this braking point, how much more pressure did Compare 1 use?
Distance brush
A strip below the chart stack shows the full lap distance. Drag horizontally to zoom all charts to a window. Reset (or choose Full lap in corner presets) restores the full range.
You can also drag horizontally across any channel chart to highlight a distance range and zoom every chart to it. Double-click a chart to return to the full lap.
The brush and corner presets work together — corner zoom sets the range; the brush (or chart drag) fine-tunes it.
Drag to reorder
Grab the grip on a chart card and drag up or down to change stack order. Order is remembered per file.
Lap overlay
Inspector charts follow the map’s lap pickers:
| Picker | On charts |
|---|---|
| Base | Primary solid line |
| Compare 1 / 2 | Additional coloured lines (up to three session laps total) |
| Community | Dashed reference lap; driver name in legend when loaded |
Out laps and the final partial lap cannot be selected as compare targets.
If compared laps have very different lap-distance lengths, a warning appears under the pickers — charts align only up to the shortest span.
Typical workflows
- Compare braking into Turn 1 — set Base to your best lap, Compare 1 to a slower lap, open Inputs or Brakes preset, use corner preset for Turn 1
- Check tyre pressure build-up — Tyres preset, full lap, scroll pressure charts while hovering to see map position
- Study one sector only — click S1 / S2 / S3 on the map footer, or use corner presets + distance brush
- Ad-hoc investigation — switch to Custom channels for any five channels
Inspector vs summary tabs
| Inspector | Strategy / Thermal / Driver / Chassis |
|---|---|
| Raw traces vs distance | Derived metrics and aggregates |
| Base / Compare laps | Lap scope from Laps tab |
| Up to 16 channels per preset | Pre-built analysis sections |
Use Inspector when you need to see the trace; use summary tabs when you need a number or trend across many laps.