
MyLMU Logo
Documentation
Sign inGet Started
Pit WallThermal and Environment
Getting Started
Product Overview
MyLMU App
MyLMU Telemetry
MyLMU Coach (AI)
MyLMU Sync Agent
Sessions
Getting Started
Session History
Session Details
Import
Sync Agent
Analytics
Milestones
MyLMU Telemetry
Getting Started
File Library
Telemetry Viewer
Overview Tab
Track Map
Pit Wall
Track Map PanelInspectorCustom ChannelsStint AnalysisSession StatsThermal and EnvironmentChassis and DriverEvents Log
Setup Tab
Leaderboard
Teams
Plans & Limits
AI Coach
Troubleshooting
MyLMU Sync Agent
Getting Started
Sessions Sync
Telemetry Sync
Daily Usage
Troubleshooting
Privacy & Security
MyLMU Coach (AI)
Getting Started
Coaching Modes
Coach Features
Troubleshooting
Privacy & Terms
Teams
Getting Started
Team Dashboard
Sharing with Your Team
Discord & Alerts
Team Calendar
Profile
Plans & Limits
Rankings
Getting Started
Skill & Discipline
Placement & Tiers
Community Leaderboard
Driver Profiles
Sessions & Imports
Notifications
Plans & Limits
Troubleshooting
Community
Getting Started
Activity
Leaderboards
Friends
Friend Groups
Lap Records
Track & Car Stats
Weekly Meta
Overall Community Stats
Feature Requests
Privacy
Troubleshooting
Misc
Opening Settings
Account & Data Lifecycle
Profile
Notifications
Appearance
Feedback
Using the Documentation
DocsMyLMU TelemetryTelemetry ViewerPit WallThermal and Environment

Thermal and Environment

Tyre thermal, pressure, and wear analysis plus track conditions and wind charts in Pit Wall.

Last updated July 14, 2026

Summarize this page with AI

Pit Wall splits condition analysis across two tabs: Thermal for tyres and Environ. for weather and track evolution. Both respect lap scope from Stint analysis.

Thermal view

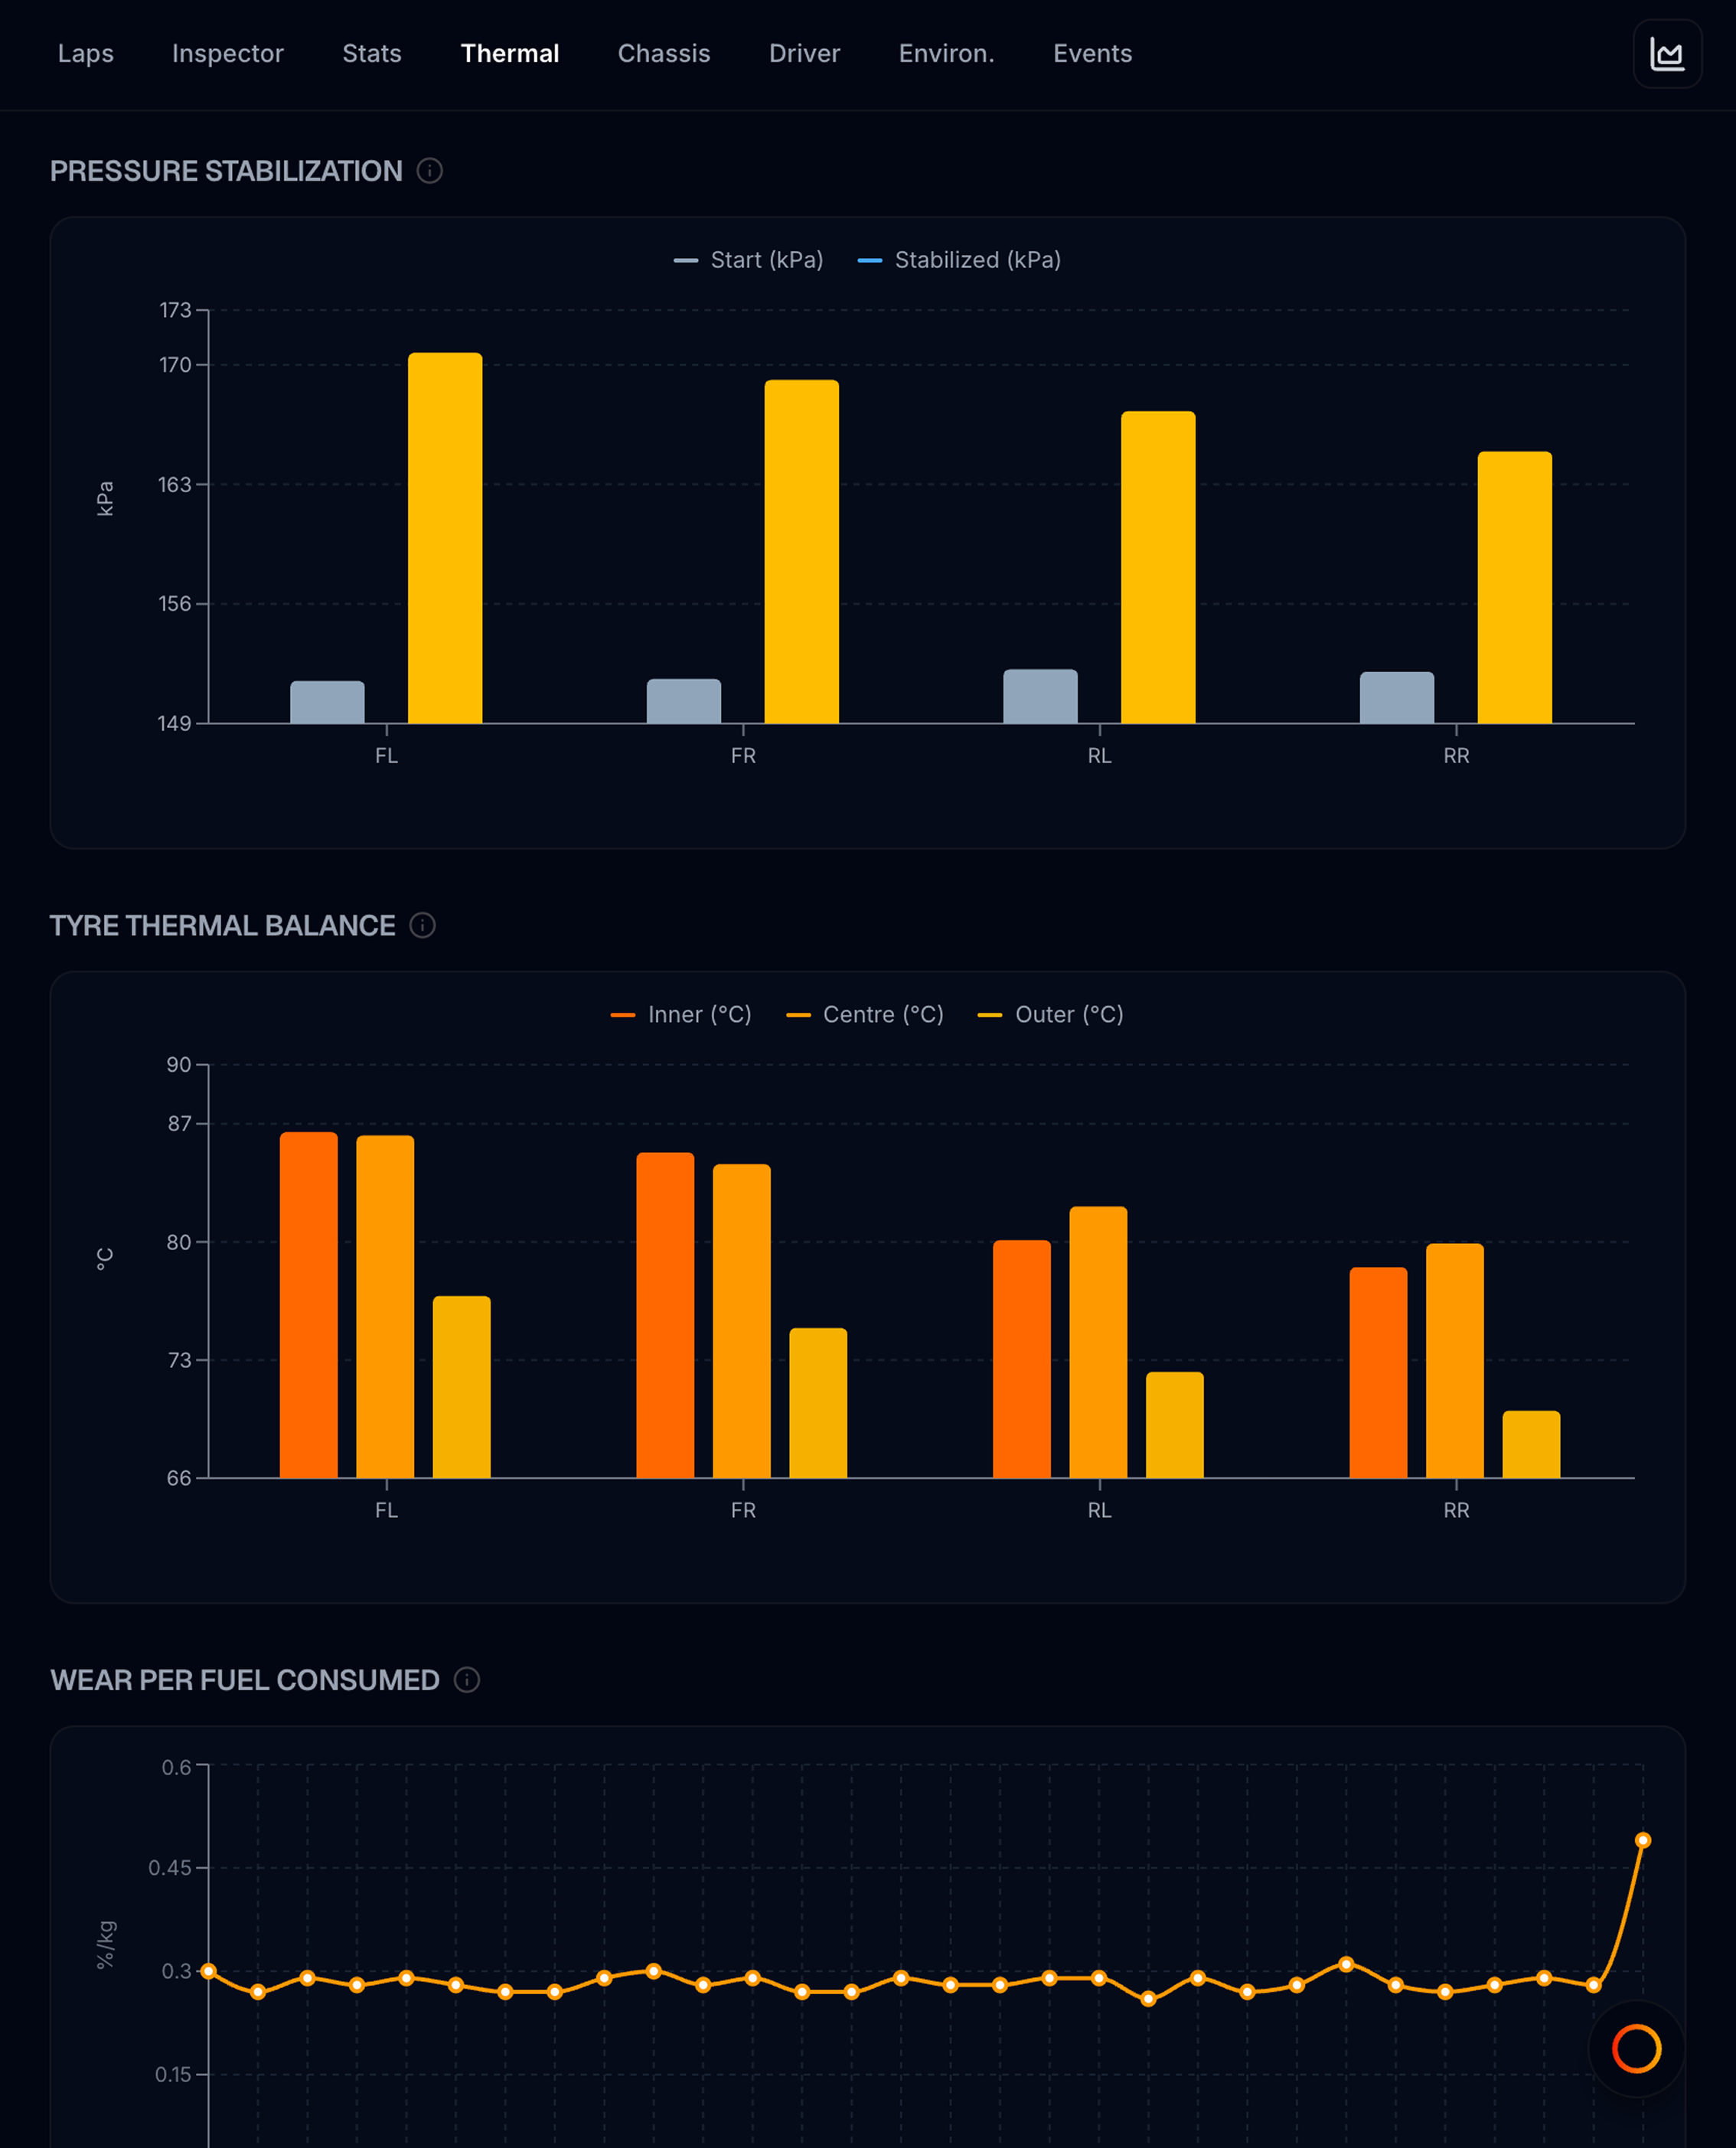
Pit Wall Thermal — pressure stabilization and tread temperatures

Open Pit Wall → Thermal tab.

Sections appear only when the recording includes tyre pressure, temperature, wear, and fuel channels. If nothing is available, you’ll see: No thermal analysis data available.

When scoped to a stint, all charts and tables recalculate for those laps only.

Pressure Stabilization

Bar chart per corner (FL, FR, RL, RR) comparing cold vs hot pressures:

BarMeaning
Start (grey)Pressure at stint beginning
Stabilized (blue)Pressure after the tyre heats up
Stabilized (amber)Corner that bled high — lost excessive pressure during heat-up

Hover a corner for the lap where pressure stabilized and whether it bled high.

How to read it: Large gaps between start and stabilized bars mean aggressive heat-up. One corner consistently amber may need pressure or camber attention — cross-check Tyre Thermal Balance on that corner.

Tyre Thermal Balance

Bar chart of average inner, centre, and outer tread temperatures per corner.

ElementMeaning
Three bars per cornerHeat distribution across the tread
Spread (in tooltip)Difference between hottest and coolest tread zone
Diagnostic label (in tooltip)Plain-language hint (e.g. pressure or camber suggestions)

Even inner/outer spread often means balanced loading; heavy inner or outer bias can point to camber or pressure tweaks.

Surface → Carcass Recovery

Per corner, how far (in metres) the surface temperature takes to match carcass temperature on the longest straight in scope.

FieldMeaning
Recovery distanceMetres until surface and carcass converge
Duct tempAverage brake duct temperature when logged

Slow recovery on one corner can mean brake ducts are too closed, excessive scrubbing in fast corners, or uneven loading — pair with Chassis → Aero Efficiency on high-speed tracks.

Wear per Fuel Consumed

Line chart per lap: tyre wear divided by fuel used (ΔWear / ΔFuel, in % per kg).

TrendInterpretation
Flat lineConsistent tyre cost per kg of fuel burned
Rising lineCar becomes more tyre-hungry as it lightens — common as fuel burns off
Spike on one lapPossible lockup, slide, or off-track moment — check that lap on Laps table

Scope to a single stint to see whether wear acceleration happens mid-stint or only after the pit stop.

Environment view

Pit Wall Environ. — track temperature and wind vs pace

Open Pit Wall → Environ. tab.

Requires track temperature, wind, and related environment channels. Empty state: No environmental data available.

Session Conditions

Full-session timeline (downsampled) vs session % (0–100% through the recording):

LineMeaning
Track temp (°C)Rubber/track surface temperature
Ambient (°C)Air temperature when logged (dashed)
Wind (km/h)Wind speed on a secondary axis when logged

Axes zoom to the data range so gradual changes stay visible — useful for long practice sessions or weather transitions.

How to use: Scan for track temp climbing in the second half — then open Track Evolution vs Pace to see if lap times moved with it.

Track Evolution vs Pace

Per-lap chart in scope:

SeriesMeaning
Track tempAverage per lap with min/max band
Ambient tempPer lap when available
V-MaxPeak speed that lap (secondary axis)

Shows whether lap pace and top speed move with track temperature over the session. A faster V-Max on a cooler lap may mean the engine or aero liked the conditions, not just grip.

Wind Sensitivity

Per-lap chart on high-speed sections only:

SeriesMeaning
Wind speed (km/h)Wind during straights
Straight speed (km/h)Speed achieved on those sections

Helps spot laps where headwind or crosswind may have cost straight-line performance. If wind spikes but straight speed holds, the layout may shield the main straight — compare with Stats → Top Speed.

Lap scope

Selecting a stint on Laps recalculates Thermal and Environment metrics for those laps only. A scope banner appears at the top of the panel with Clear filter.

Inspector charts are not scoped — they always follow Base / Compare lap pickers.

Workflows

GoalSteps
Diagnose hot tyre on one cornerScope stint → Pressure Stabilization + Tyre Thermal Balance for that corner
Check stint tyre fadeStint 1 vs Stint 2 → Wear per Fuel trend
Understand pace vs weatherFull session → Session Conditions, then Track Evolution vs Pace
Explain slow straightWind Sensitivity + Stats → Top Speed on the same laps

Related

  • Stint analysis
  • Session stats
  • Chassis and driver
  • Overlays and modals — live tyre overlay during Track Map replay

Was this page helpful?

PreviousSession StatsNextChassis and Driver

On this page

  • Thermal view
  • Pressure Stabilization
  • Tyre Thermal Balance
  • Surface → Carcass Recovery
  • Wear per Fuel Consumed
  • Environment view
  • Session Conditions
  • Track Evolution vs Pace
  • Wind Sensitivity
  • Lap scope
  • Workflows
  • Related

Was this page helpful?

Documentation

  • Getting started
  • Product overview
  • Sessions
  • MyLMU Telemetry
  • MyLMU Sync Agent
  • MyLMU Coach (AI)
  • Teams
  • Rankings
  • Community
  • Misc

Product

  • Open dashboard
  • Sync Agent
  • Contact
  • Pricing
  • Changelog
  • FAQs
  • Branding

Community

  • Instagram
  • Community forum
  • YouTube
  • X

© 2026 MyLMU

•Privacy Policy•Terms of Service•Cookie Policy